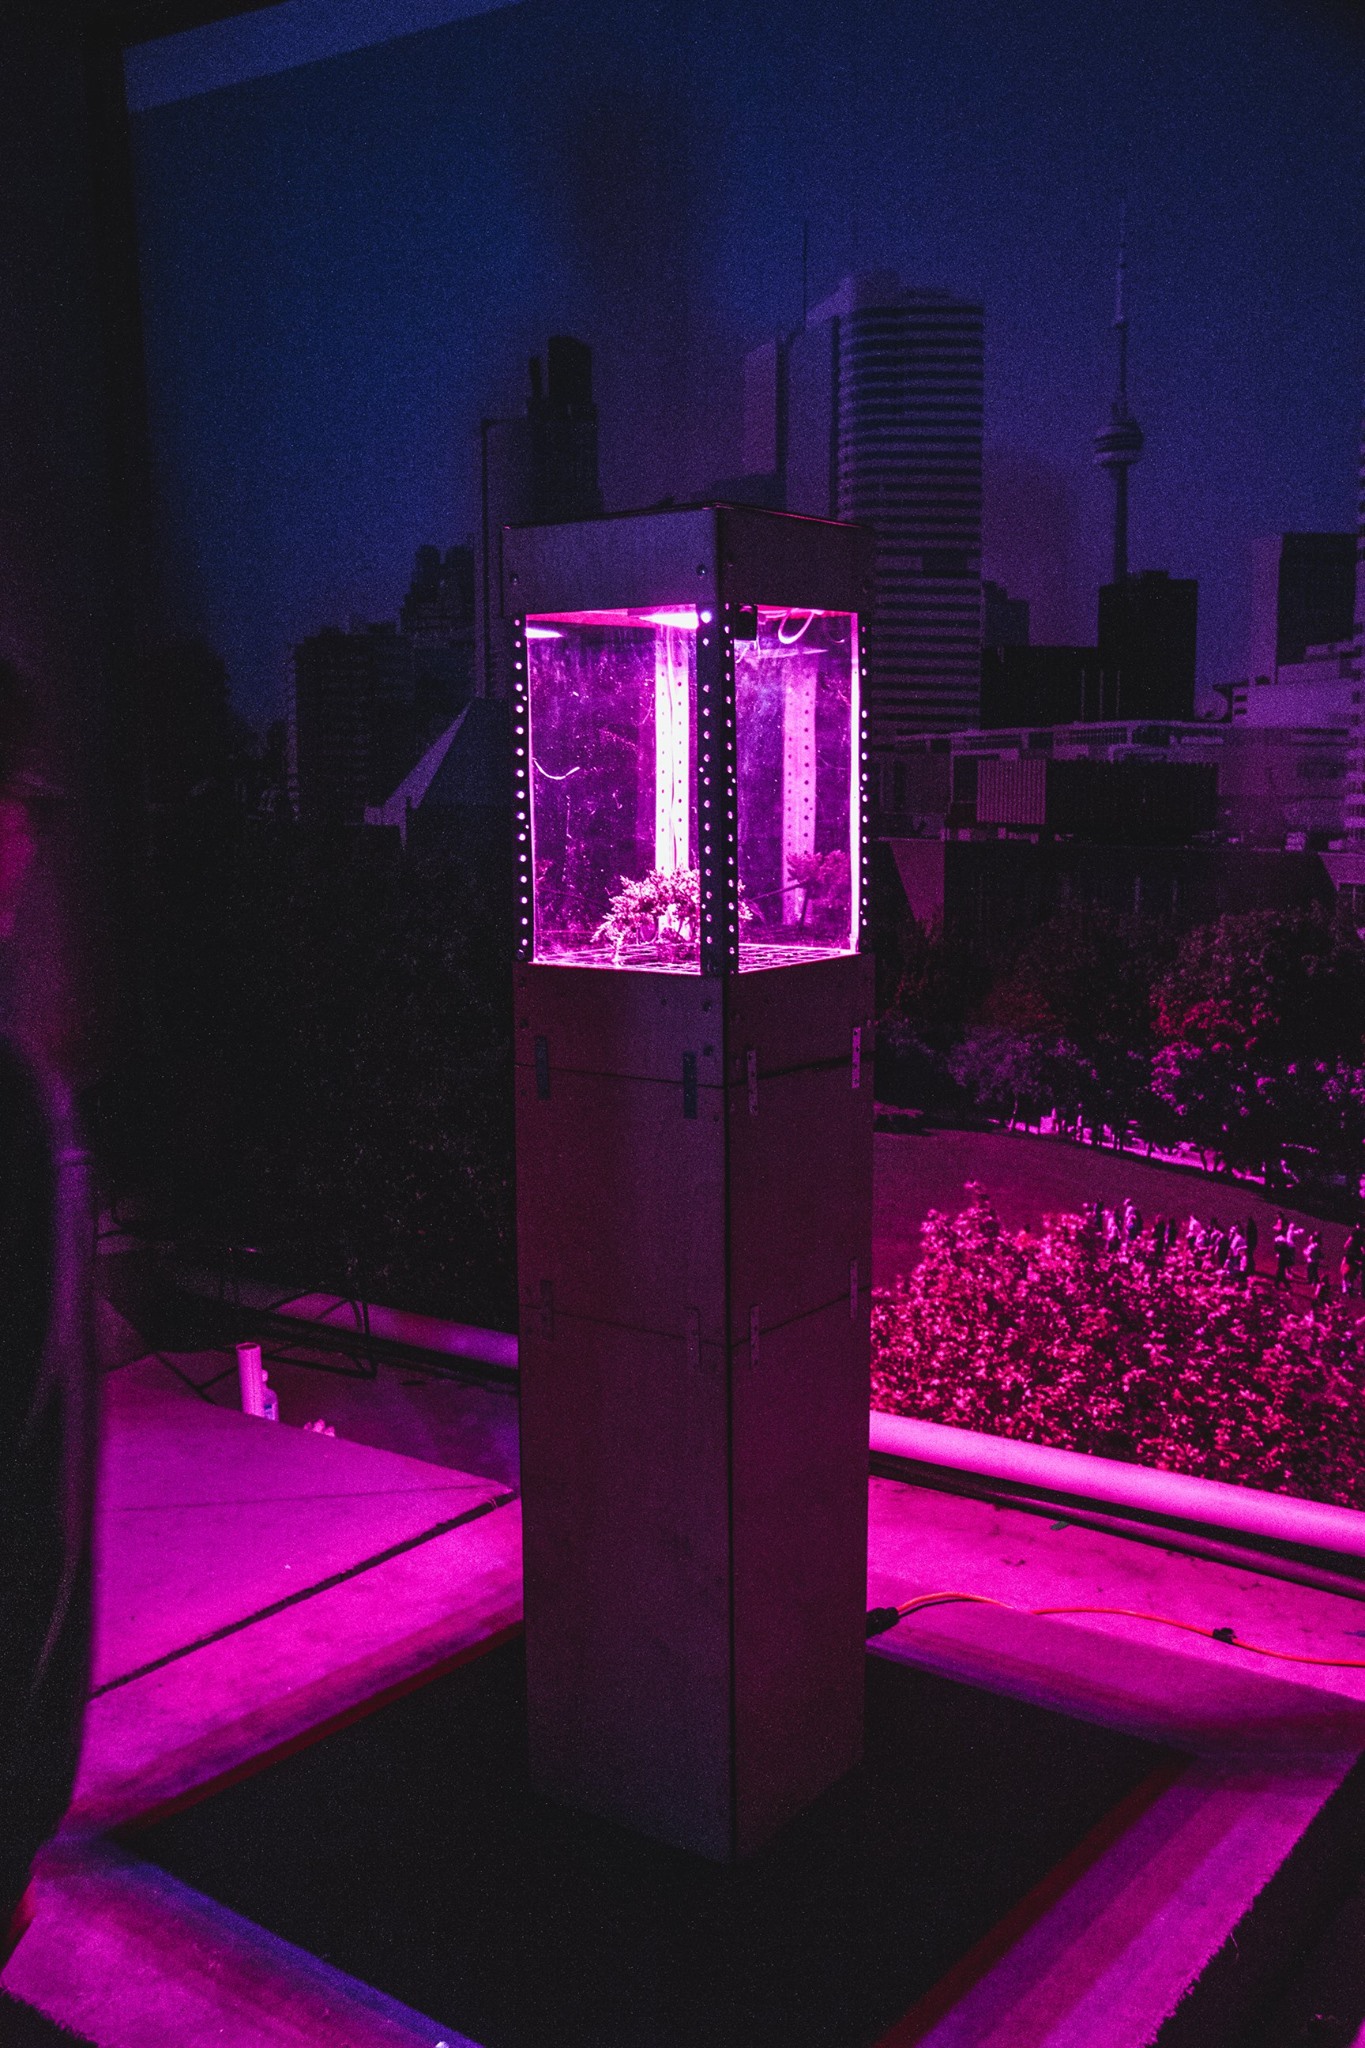
A tangible data visualization of general projected quality of life as demonstrated on social media.
Using the Twitter API the piece listens for tweets that contain either positive or negative keywords (ie. “Love”, “Hate”). It then totals those keywords and every 24hrs. If positive totals higher than negative the greenhouse will provide the tree light and water– otherwise it gives the tree nothing.
From this project’s inception I knew I wanted to create a piece that was both organic and technologically motivated. I initially wasn’t entirely certain what route to take but as I explored the internet and stumbled upon Twitter‘s open API I knew that I had something.
I first taught myself how the API worked, how to pull different information and scan tweets for certain phrases and keywords. From there I wrote a simple Java application to scan for positive and negative keywords then total those words. From there I setup a basic Amazon Web Server to host the application– this was done so the application could be running all the time. I then set the application up to push that data every 24 hours to a private web page.
As far as the physical side of the display I’d always want to do something with plants– I think there’s something so beautiful about plant-life in itself so I knew I could expand on that.
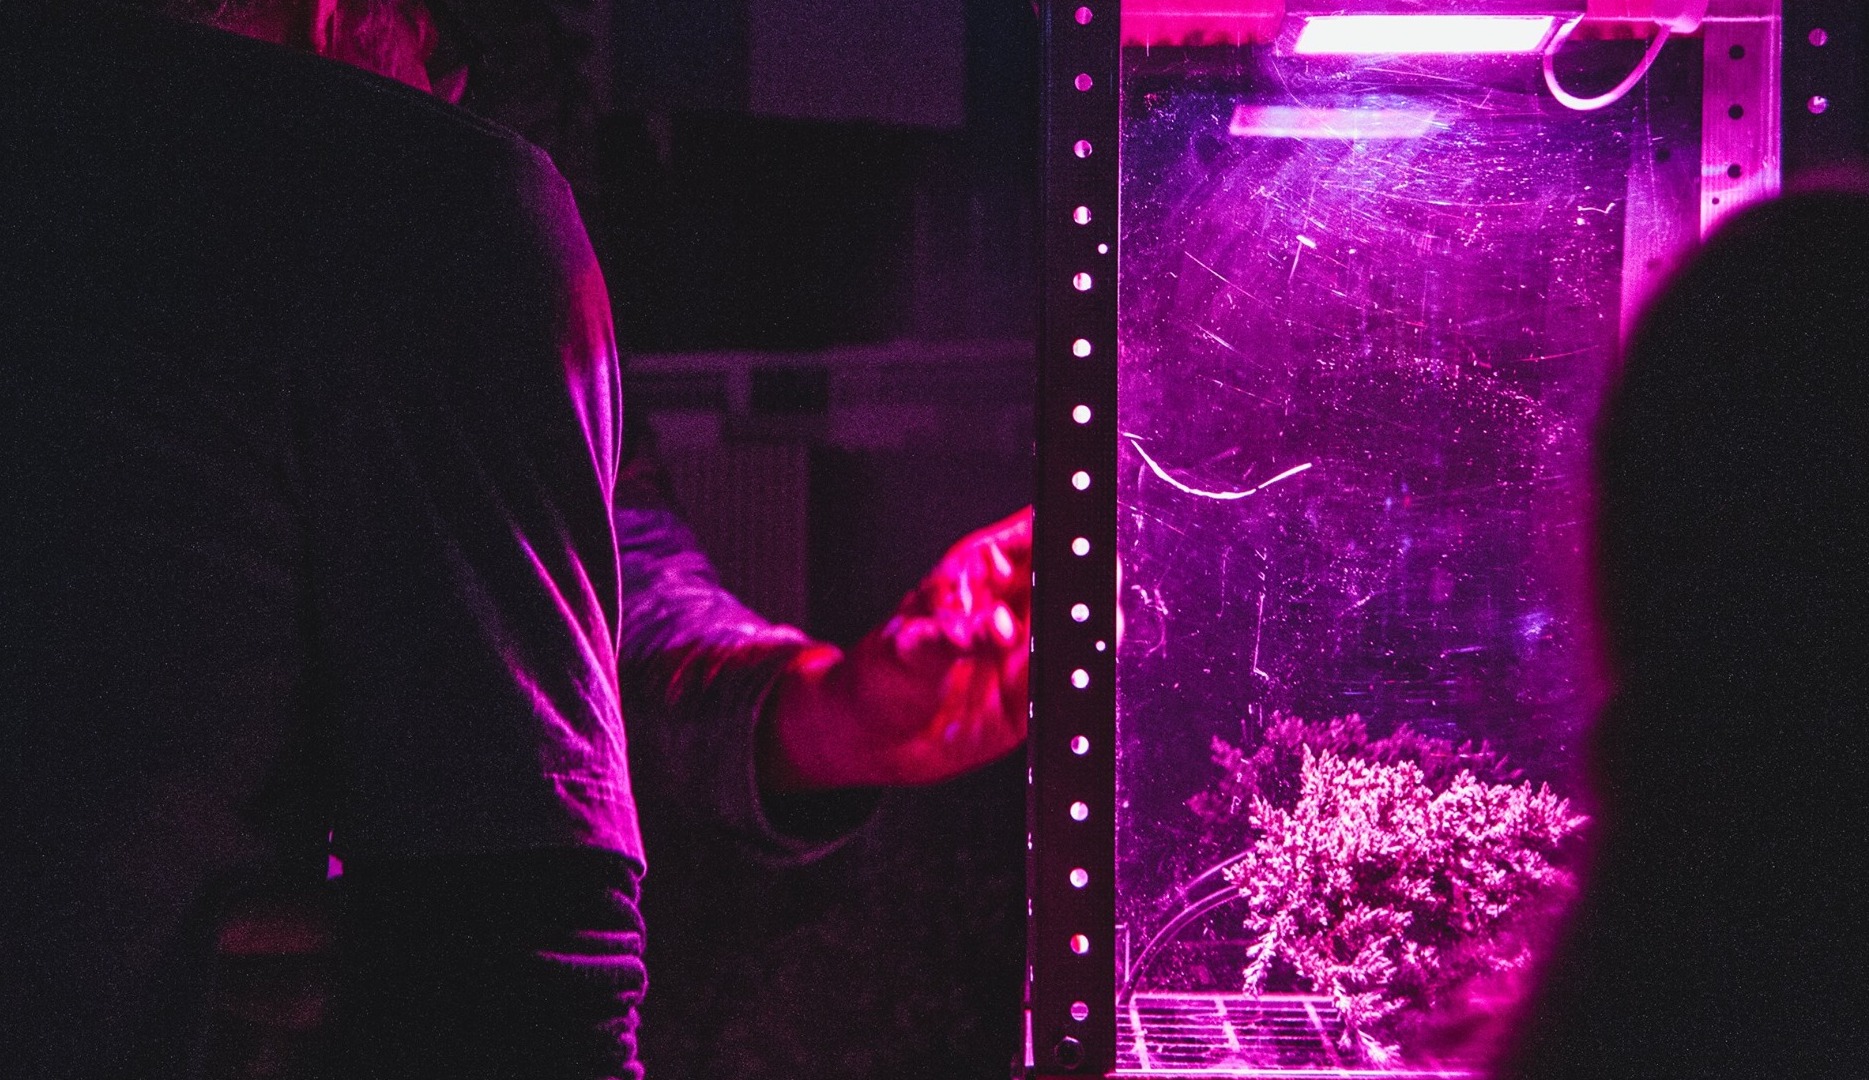
I read a few articles and on greenhouse construction and from that drafted up my own little green space. Utilizing a pump system, adding fans for air circulation and finally adding a UV light I wired the whole setup to an Arduino with a wifi shield and coded it to pull that aforementioned information from the web page I’d set up.
Based on that the plant life was left up to social media influencers and internet trolls alike!
Of course the big question is in the end did the plant live or die?
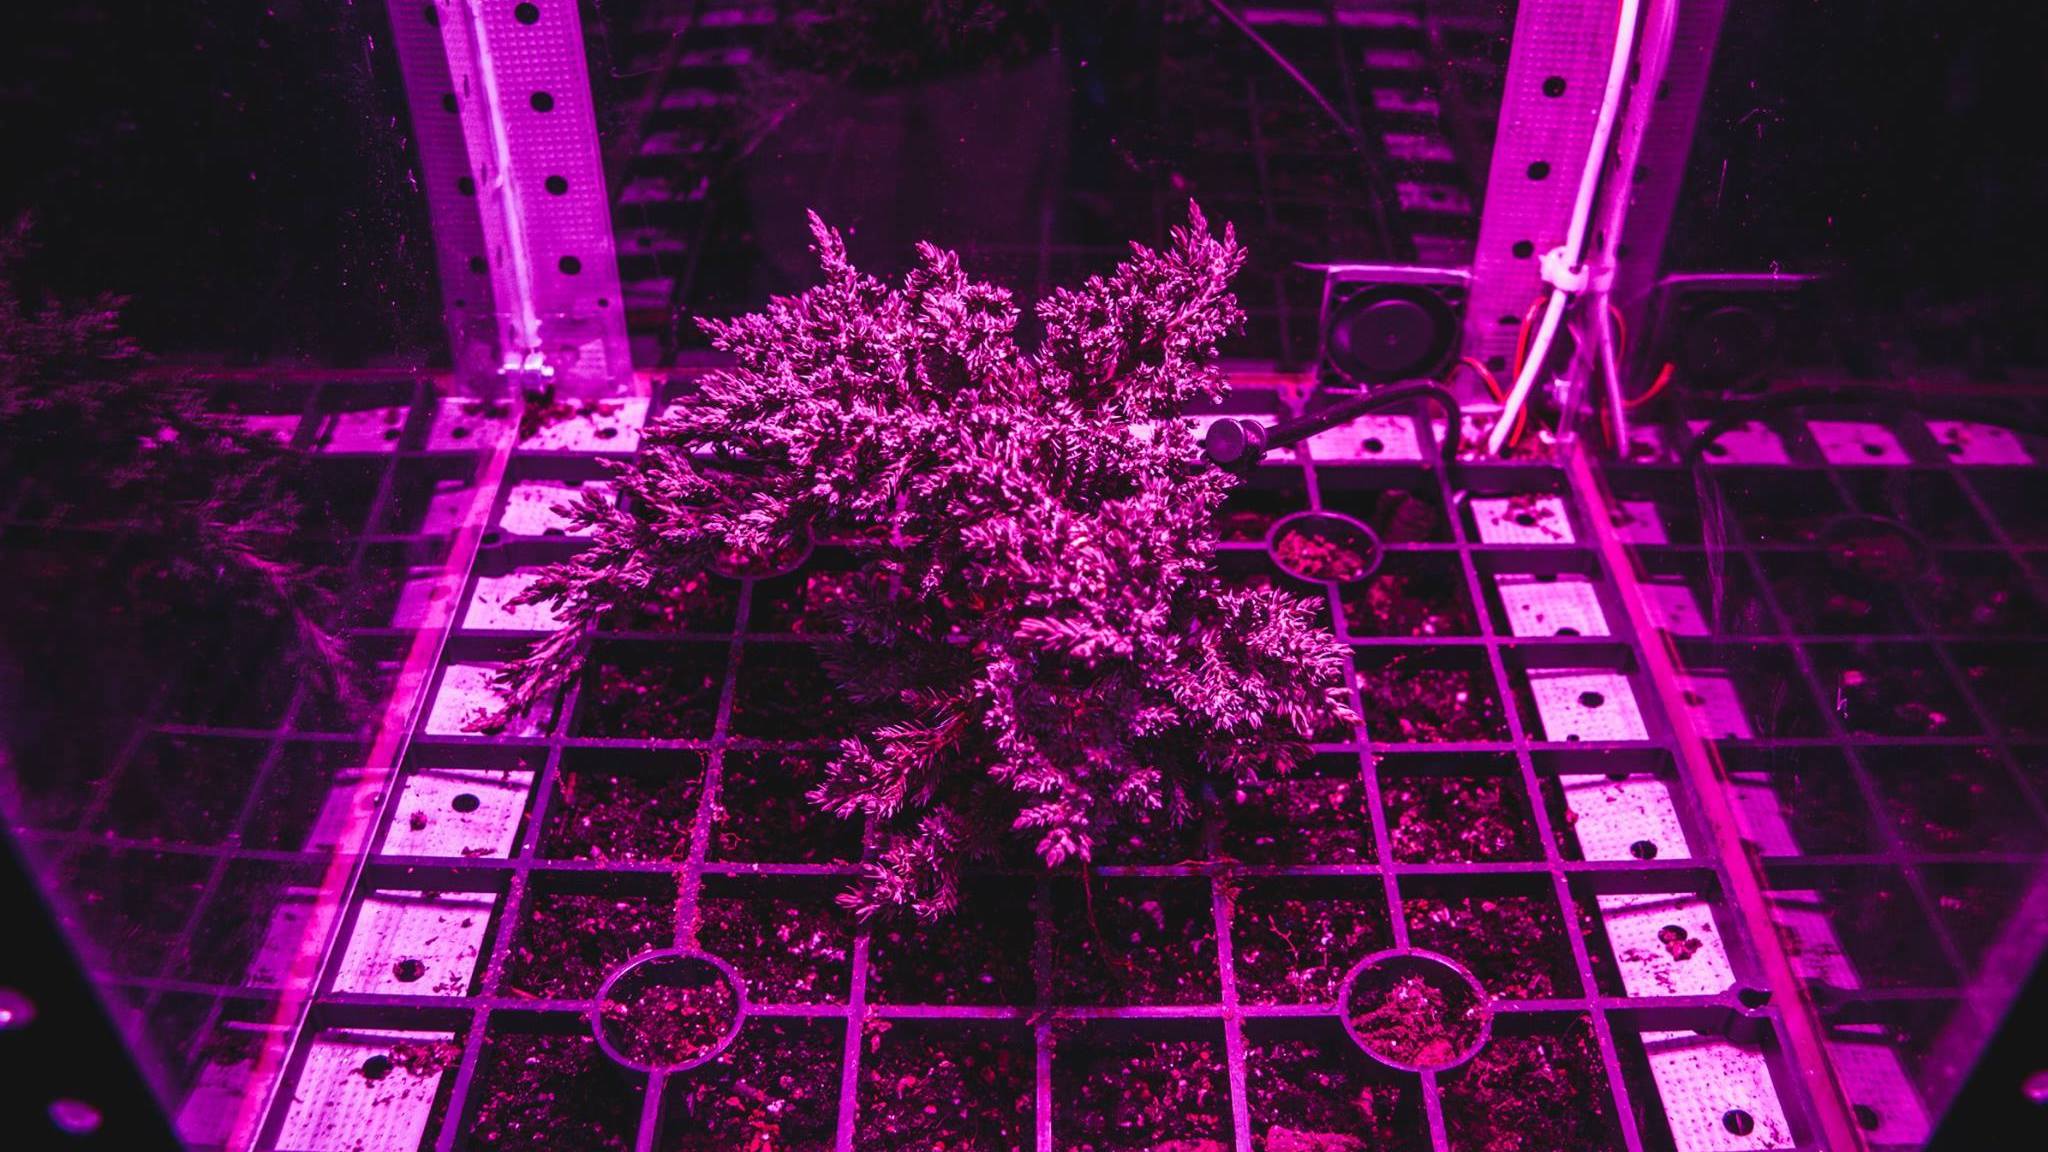
It lived. Twitter users are overwhelmingly positive, or at least that’s what they choose to share most often. The greenhouse installation ran for two months before being repurposed into a conversation piece in my living room– it was a total hit at parties. This project taught me the importance of drafting project designs and prototyping. If I were to do the process over again I would construct the project in pieces for ease of transportation. However this is still the piece I’m probably most proud of.